New comment from the Royal Observatory at Belgium:
GOES X-ray flux shows a continuing pattern of solar flaring in the A3 to B1 range.
Within two days, AR2733 will depart the visible solar disc.
COMMENT: No C-class flares in past 24 h. Solar activity is expected to
remain at low levels with a possibility of isolated C-class flares from
NOAA AR 2733 (beta magnetic field configuration).
No Earth directed Coronal Mass Ejections (CMEs) have been detected. Solar
protons have remained at background levels over the past 24 hours.
The solar wind speed is at 390 km/s with interplanetary magnetic fields of
4 nT. Geomagnetic conditions have been quiet. The fast solar wind
associated with a negative polarity equatorial coronal hole is expected to
arrive to the Earth late on January 30. Quiet conditions are expected until
then.
TODAY'S ESTIMATED ISN : 017, BASED ON 18 STATIONS.
Below is the EISN from Belgium's consortium of international astronomers. Comments in brackets are mine. Whenever there are five or more outliers and/or there is a standard deviation greater than 3.0, then expect Belgium to make changes by the first of the next month.
2019 01 01 2019.001 13 1.4 18 22
2019 01 02 2019.004 18 2.9 26 31 - 5 outliers
2019 01 03 2019.007 18 3.3 26 29 - 3 outliers + Standard Deviation is greater than three.
2019 01 04 2019.010 14 2.0 24 27
2019 01 05 2019.012 13 2.6 15 21 - 6 outliers
2019 01 06 2019.015 0 0.0 14 19 - 5 outliers
2019 01 07 2019.018 0 0.0 20 21
2019 01 08 2019.021 0 0.0 23 24
2019 01 09 2019.023 0 0.0 30 32
2019 01 10 2019.026 0 0.0 17 18
2019 01 11 2019.029 0 0.0 18 18
2019 01 12 2019.032 0 0.0 11 12
2019 01 13 2019.034 0 0.0 16 17
2019 01 14 2019.037 0 0.0 34 35
2019 01 15 2019.040 0 0.0 21 22
2019 01 16 2019.042 0 0.0 18 21
2019 01 17 2019.045 0 0.0 23 23
2019 01 18 2019.048 0 0.0 25 26
2019 01 19 2019.051 0 0.0 27 28
2019 01 20 2019.053 0 0.0 30 30
2019 01 21 2019.056 0 0.0 21 34 - 13 outliers + Belgium's sketch showed an EISN of 11.
2019 01 22 2019.059 17 1.5 21 26 - 5 outliers
2019 01 23 2019.062 20 1.9 21 25
2019 01 24 2019.064 23 2.9 23 25
2019 01 25 2019.067 27 3.8 19 21 - 2 outliers + Standard deviation is greater than three.
2019 01 26 2019.070 28 2.5 14 18
2019 01 27 2019.073 24 2.3 12 15
2019 01 28 2019.075 18 1.9 26 30
The approximated mean EISN for January most likely will fall between 8.5 to 9.4. If so, Belgium's favored CM (Combined Method) prediction below shows that we might be coming out of this solar minimum quickly. However, this rise in international sunspot numbers (ISN) could be a temporary aberration with lower future ISN's, which would indicate a deepening solar minimum as the Standard Curve (SC) prediction shows below (see red dotted curve). We are at a crossroads.
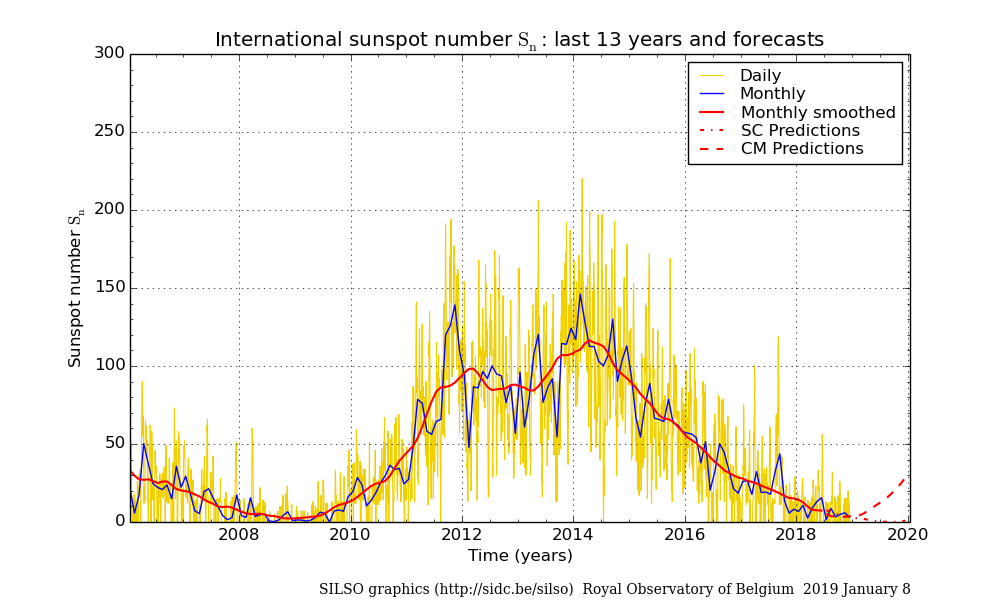
- monthly-sunspot-numbers-smoothed-2019-01-wolfjmms.png (138.3 KiB) Viewed 2916 times
Notice the years in which scientists were faked out by a rise and then sudden decrease in sunspot numbers: 1808, 1822, 1877, 1887, 1900, 1963, and 1975. Our current solar cycle could resemble that of 1800 to 1815, which was part of the Dalton Solar Minimum, with very cold winters.