From January 6 through January 20, we have had 15 days of a spotless sun.
Today, January 21, Belgium presented an illustration which apparently showed 11 sunspots.
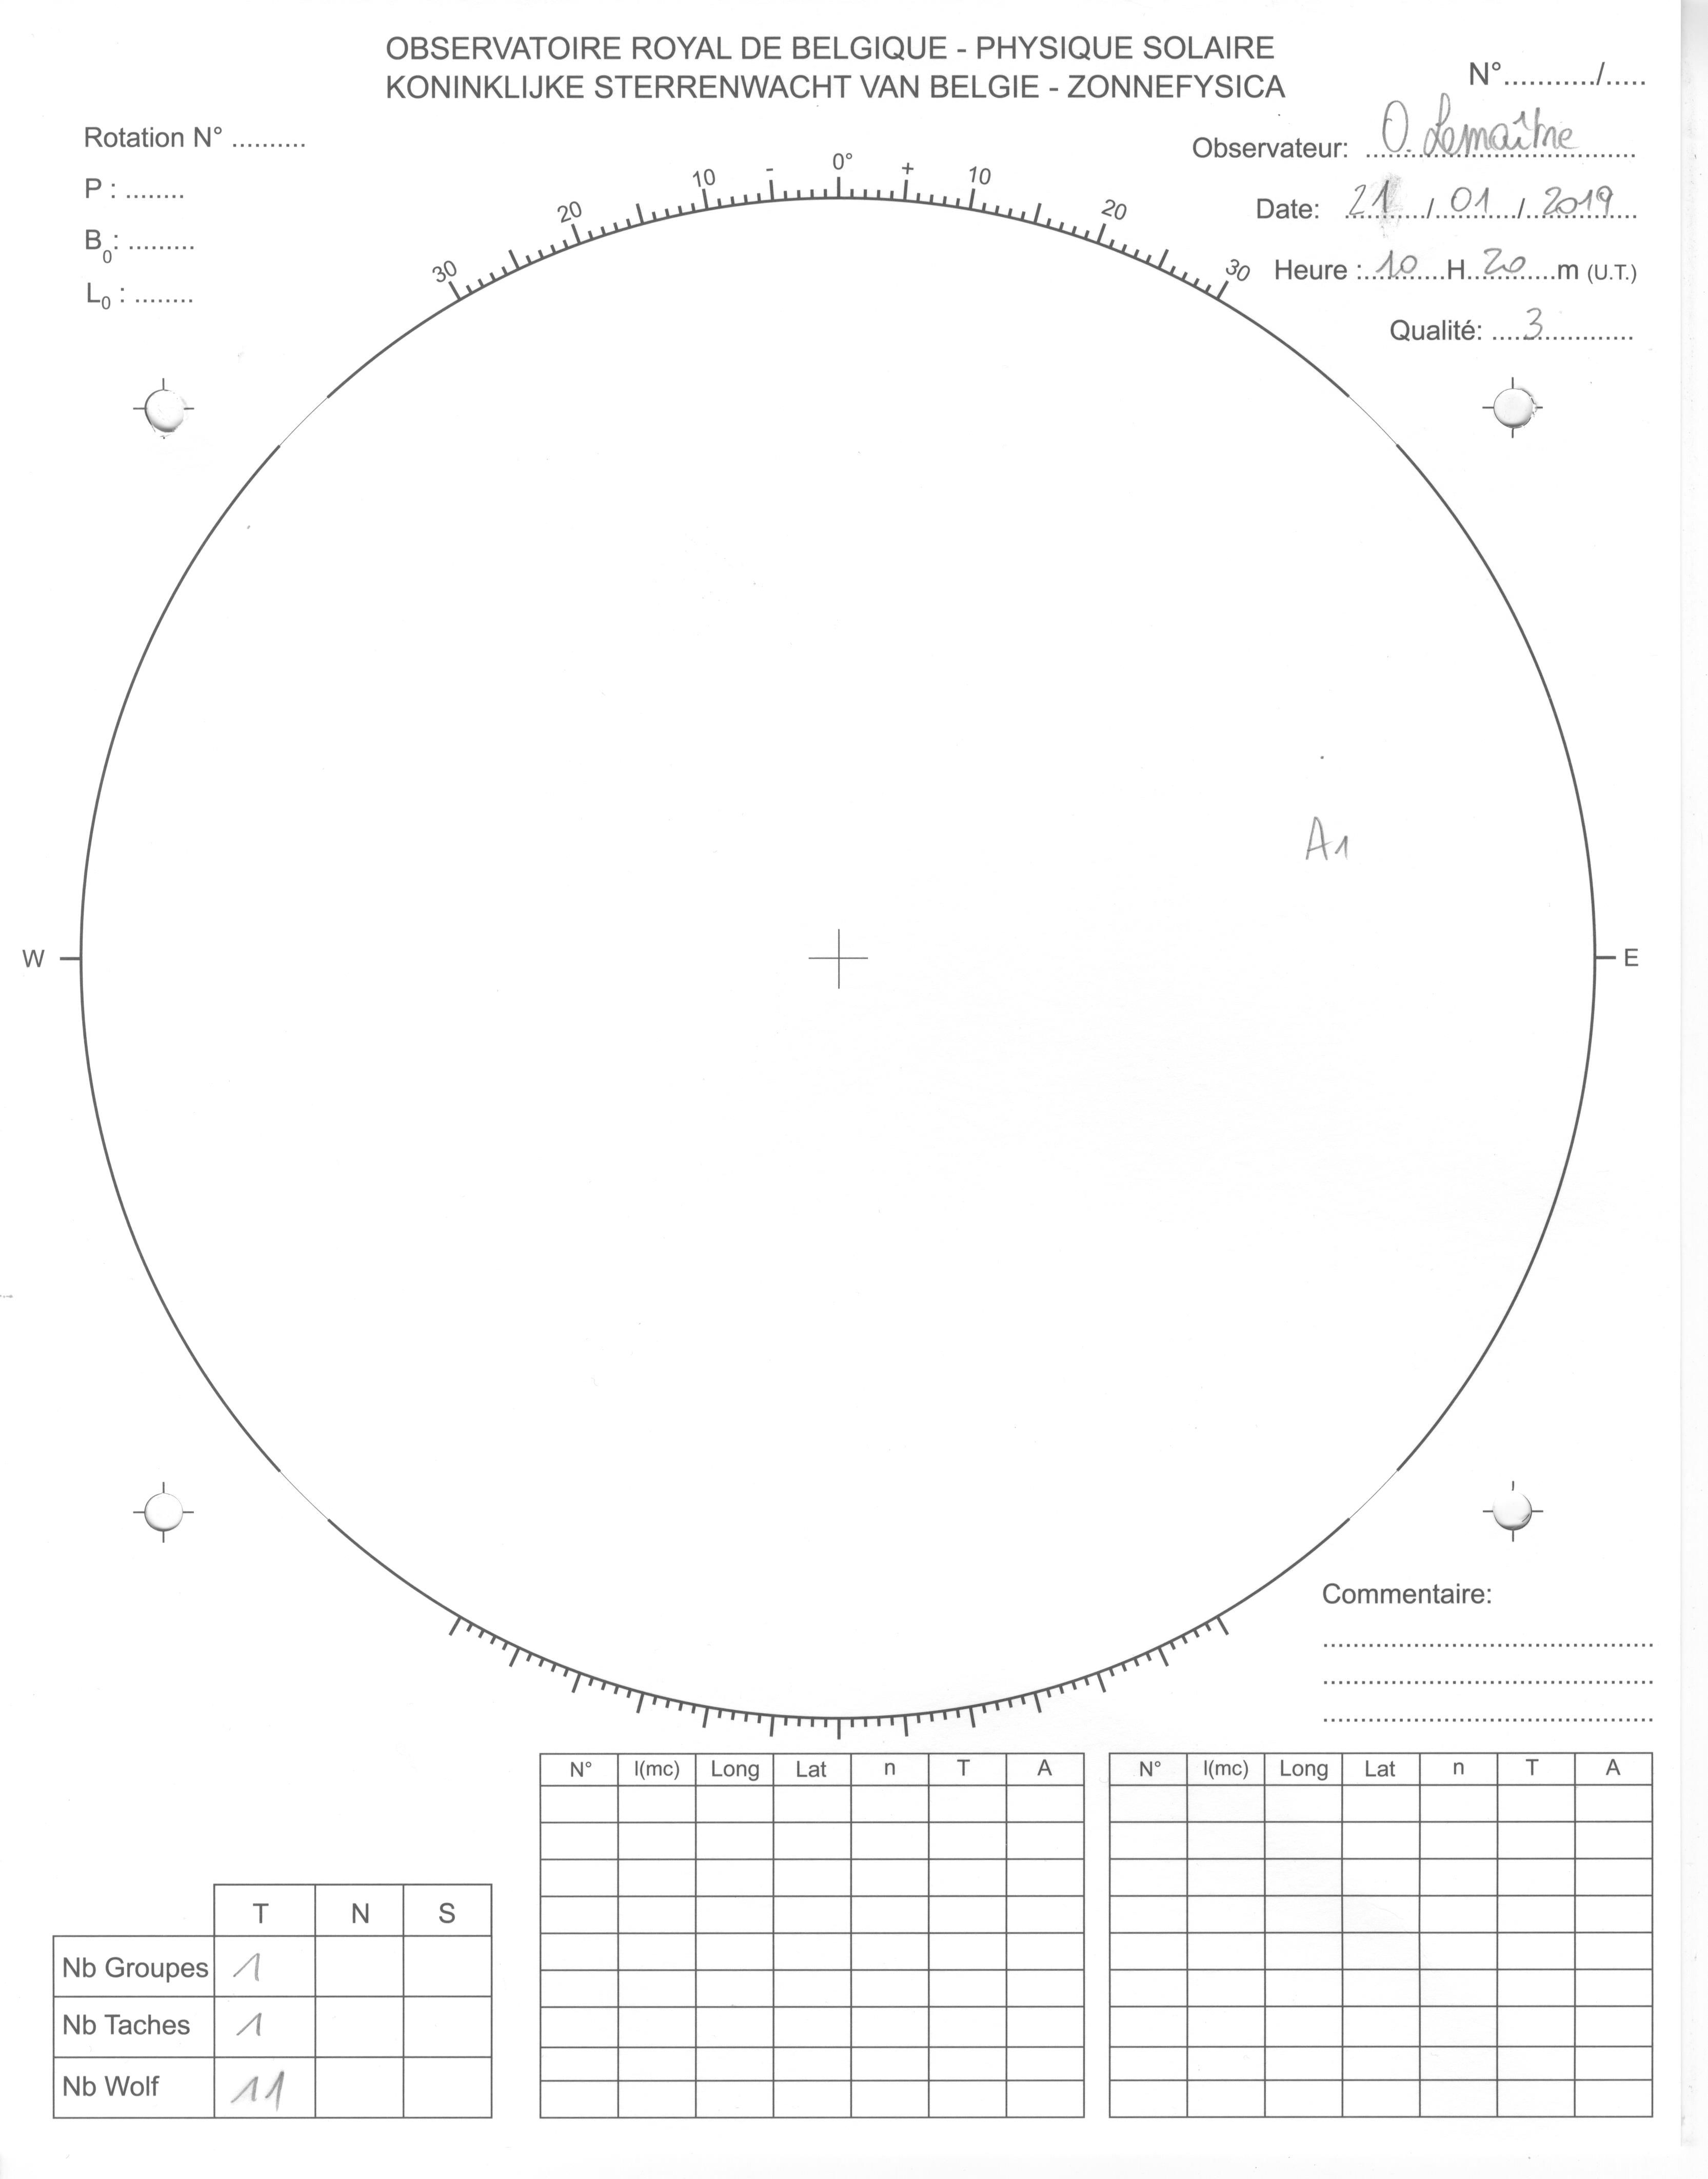
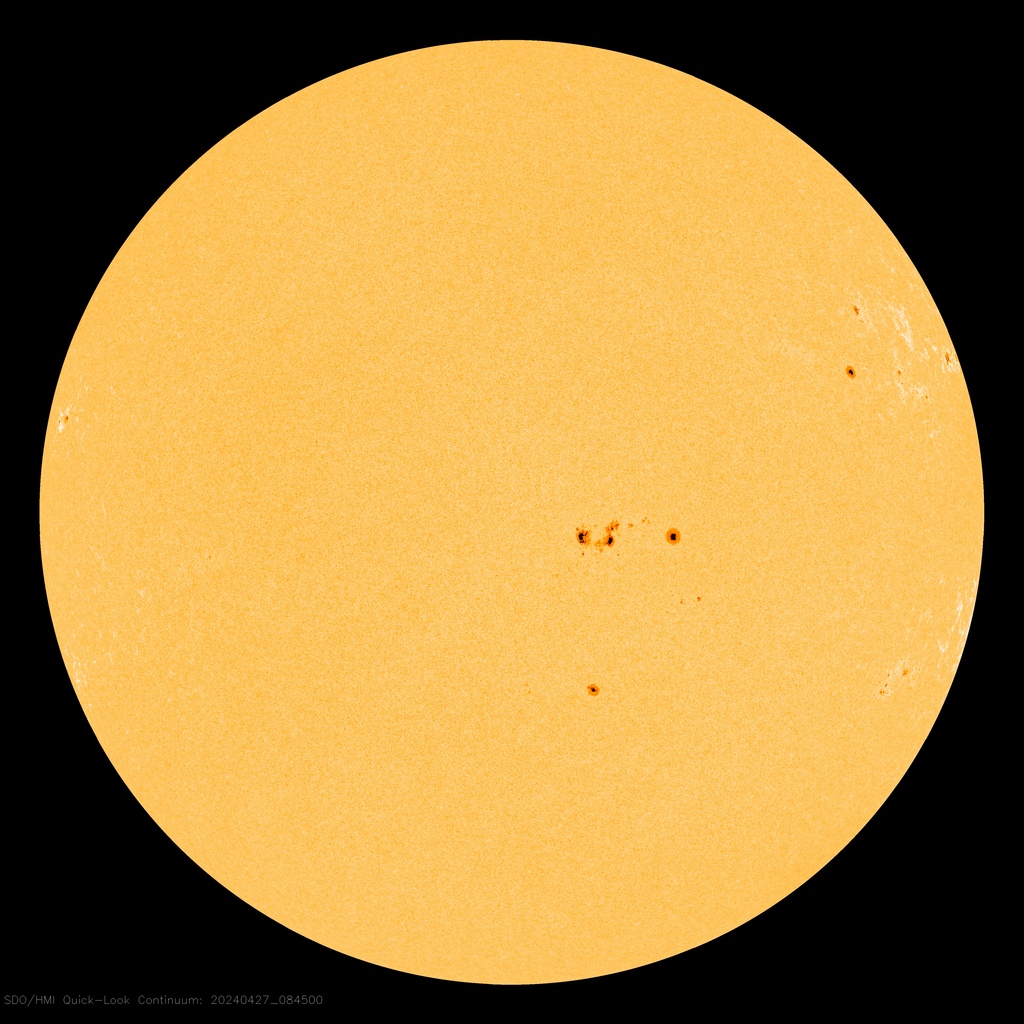
And later in the day, an active region rapidly developed in the northeastern latitude of the sun.
At spaceweather.com ( http://www.spaceweather.com/ ), this emerging sunspot is encircled.
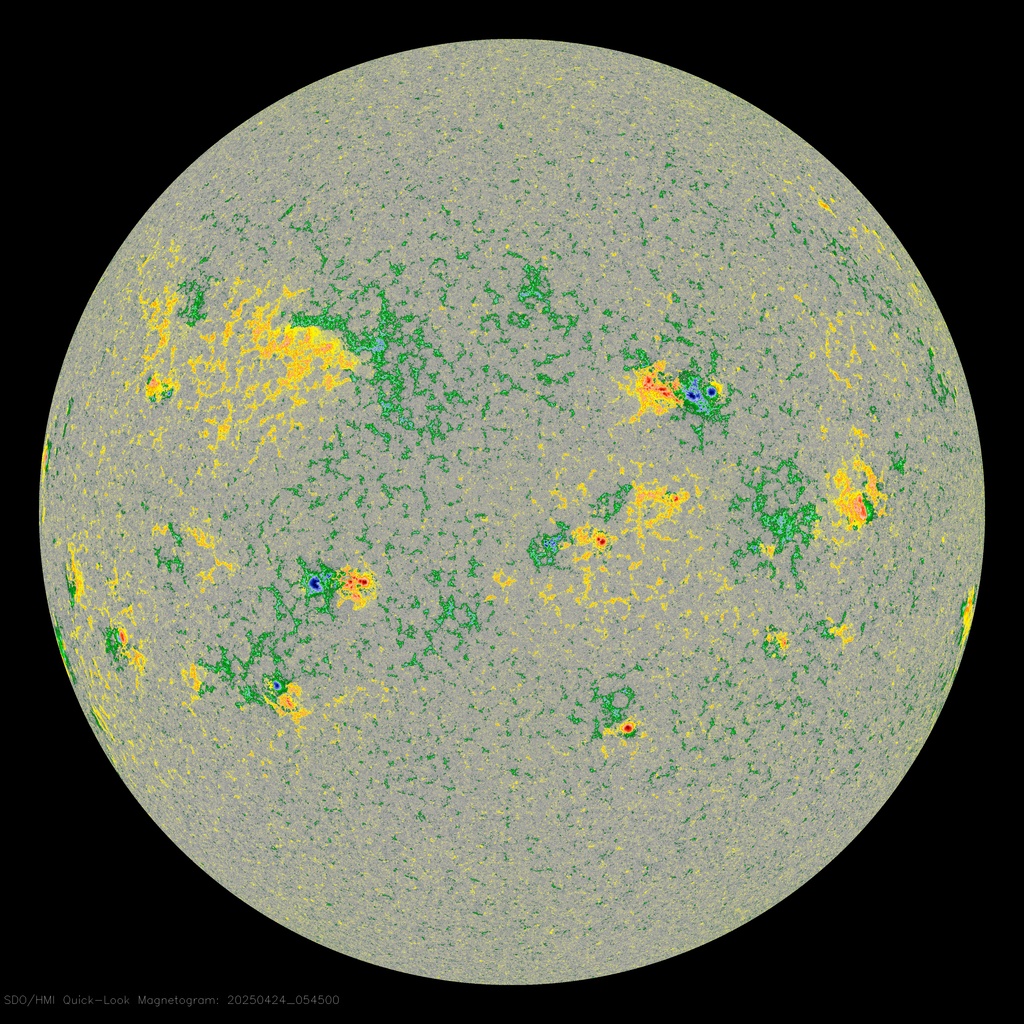
Click to view the latest dynamic HMI image. The new active region is shown in green(+)/yellow(-) polarity with orange sunspots.
https://sdo.gsfc.nasa.gov/assets/img/la ... _HMIBC.jpg
In addition, the GOES X-ray flux plot showed increased solar flaring in the A1 through A3 levels.
You can see the plot here: https://www.swpc.noaa.gov/products/goes-x-ray-flux
Here is the raw text data from Belgium's consortium of international astronomers:
Significant differences (5+ outliers) are noted in italics. This is the difference between reports presented and those accepted.
2019 01 01 2019.001 13 1.4 18 22
2019 01 02 2019.004 18 2.9 26 31 - 5 outliers
2019 01 03 2019.007 18 3.3 26 29
2019 01 04 2019.010 14 2.0 24 27
2019 01 05 2019.012 13 2.6 15 20 - 5 outliers
2019 01 06 2019.015 0 0.0 13 18 - 5 outliers
2019 01 07 2019.018 0 0.0 19 20
2019 01 08 2019.021 0 0.0 23 24
2019 01 09 2019.023 0 0.0 29 31
2019 01 10 2019.026 0 0.0 16 17
2019 01 11 2019.029 0 0.0 18 18
2019 01 12 2019.032 0 0.0 10 11
2019 01 13 2019.034 0 0.0 15 16
2019 01 14 2019.037 0 0.0 33 34
2019 01 15 2019.040 0 0.0 20 21
2019 01 16 2019.042 0 0.0 15 18
2019 01 17 2019.045 0 0.0 22 22
2019 01 18 2019.048 0 0.0 22 23
2019 01 19 2019.051 0 0.0 23 24
2019 01 20 2019.053 0 0.0 27 27
2019 01 21 2019.056 0 0.0 17 29 12 outliers