Here is the current Estimated International Sunspot Number (EISN) plot for April 2018.
With the advent of the active regions, AR2706 and AR2707, the EISN has increased to approximately 6 or 6.5. AR2707 is already showing signs of decay. If AR2706 does not decay, but maintains its sunspot numbers as it transits across the sun, then the EISN will keep increasing.
Notice that for today, April 22, 2018, the reported sunspots in AR2706 have already declined from 30 to 21. However, six outliers have been deleted from this tally. In other words, although 36 astronomical stations have reported data, only 30 of those have been accepted. The standard deviation is quite high at 3.6, but yesterday, the standard deviation was even higher at 6.7.
2018 04 01 2018.248 0 4.5 16 22
2018 04 02 2018.251 0 0.0 26 27
2018 04 03 2018.253 0 0.0 27 30
2018 04 04 2018.256 0 0.0 27 29
2018 04 05 2018.259 0 0.0 36 38
2018 04 06 2018.262 0 0.0 37 37
2018 04 07 2018.264 0 0.0 31 31
2018 04 08 2018.267 0 0.0 34 36
2018 04 09 2018.270 0 0.0 20 25
2018 04 10 2018.273 7 5.9 34 35
2018 04 11 2018.275 0 0.0 30 32
2018 04 12 2018.278 9 6.9 25 26
2018 04 13 2018.281 15 1.5 17 24
2018 04 14 2018.284 0 0.0 22 34
2018 04 15 2018.286 7 6.6 23 25
2018 04 16 2018.289 12 1.7 24 39
2018 04 17 2018.292 11 1.5 30 41
2018 04 18 2018.295 0 0.0 30 39
2018 04 19 2018.297 12 1.4 25 43
2018 04 20 2018.300 16 2.5 38 44
2018 04 21 2018.303 25 6.7 29 31
2018 04 22 2018.305 21 3.6 30 36 - notice that 6 outliers have been deleted
See the previous post and compare the two EISN charts. This is to be expected as the monthly numbers will jump and fall. As the solar minimum deepens during May 2018, the EISN will most likely fall once again, perhaps to a deeper low, or it could rise again. Again, time will tell.
For comparison, in March 2018 the ISN was 2.5.
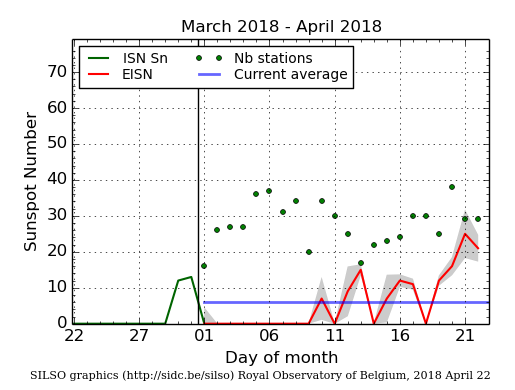
- Daily Sunspot Plot thru 04-22-2018_EISN current.png (43.57 KiB) Viewed 1554 times
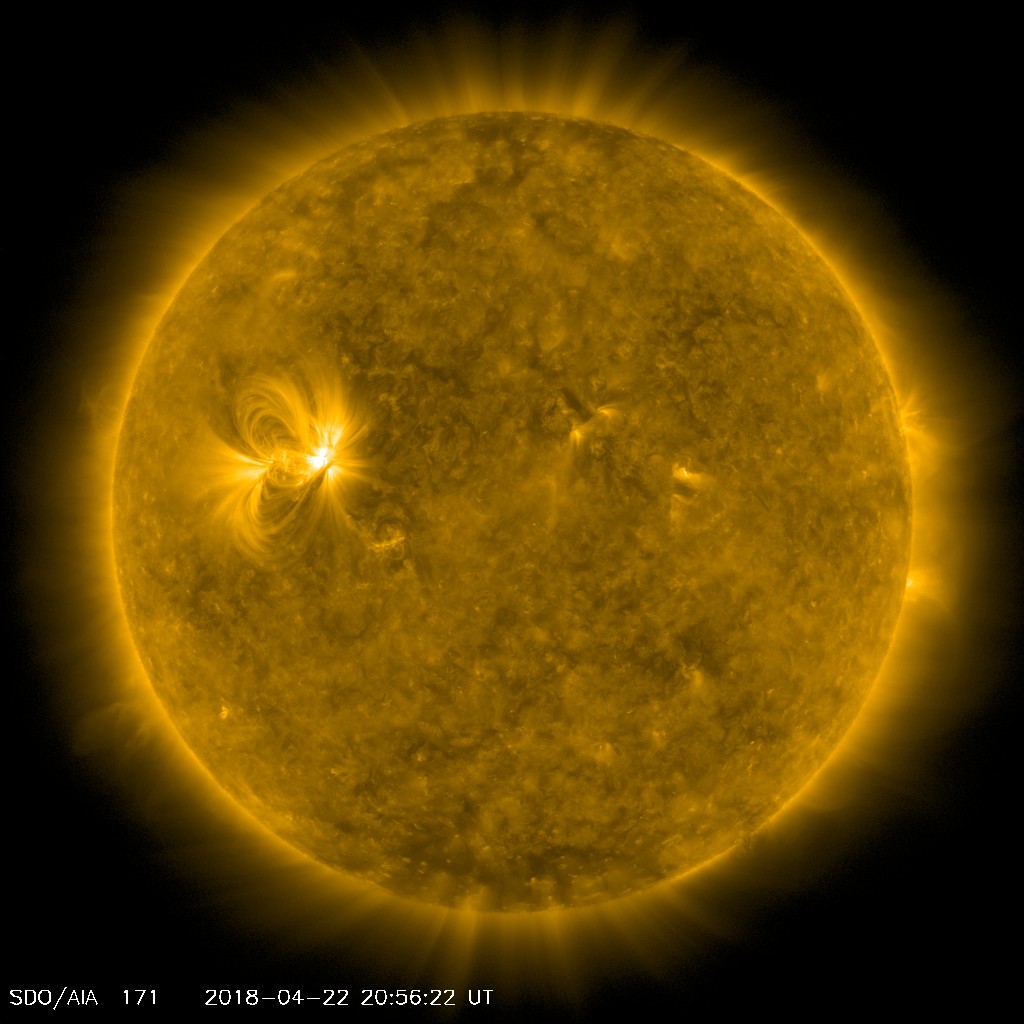
- solar image_04-22-2018_Beta 2706_2056 UT.jpg (152.1 KiB) Viewed 1554 times