The sun has been consistently spotless for 20 of the 24 days in March.
However, this is not a continuous stretch as it was broken with the appearance
of active regions AR2701 and AR2702 as numbered by NOAA.
This leaves four days that are in question.
All four of these days (see italicized notes below) have high standard deviations with outliers which have been deleted.
As the astronomers send in their reports, the results fluctuate between spotless days and days with sunspots, so
Belgium may or may not declare those days, especially days 1 and 18, to have had spots. Nevertheless from past
records, I expect Belgium to determine that all four of these days did indeed have spots. The results on Day 19 are
still too early to call, but it leans toward a spotless day.
Belgium's EISN msg text wrote:
Date . . . . . . . . . EISN std st str
2018 03 01 2018.163 7 6.0 21 22 - high standard deviation of 6.0 with only one outlier rejected.
2018 03 02 2018.166 0 3.5 11 17 - high standard deviation of 3.5 with six outliers rejected
2018 03 03 2018.168 0 0.0 28 29
2018 03 04 2018.171 0 0.0 35 36
2018 03 05 2018.174 0 0.0 28 29
2018 03 06 2018.177 0 0.0 25 26
2018 03 07 2018.179 0 0.0 18 19
2018 03 08 2018.182 0 0.0 30 33
2018 03 09 2018.185 0 0.0 29 30
2018 03 10 2018.188 0 0.0 22 23
2018 03 11 2018.190 0 0.0 30 31
2018 03 12 2018.193 0 0.0 34 36
2018 03 13 2018.196 0 0.0 25 27
2018 03 14 2018.199 0 0.0 34 34
2018 03 15 2018.201 0 0.0 20 25
2018 03 16 2018.204 0 0.0 29 30
2018 03 17 2018.207 0 0.0 8 16 - half of the reports (8/16) have been rejected as outliers
2018 03 18 2018.210 7 6.8 22 24 - high standard deviation of 6.8 with two outliers rejected
2018 03 19 2018.212 0 0.0 24 28 - four outliers rejected
2018 03 20 2018.215 0 0.0 32 33
2018 03 21 2018.218 0 0.0 30 31
2018 03 22 2018.221 0 0.0 22 23
2018 03 23 2018.223 0 0.0 22 22
2018 03 24 2018.226 0 0.0 22 24
Days 1 and 2 as well as days 17 and 18 all have inconclusive reports, which will need to be resolved by Belgium.
On Days 2 and 17 few scientific reports have been accepted, less than 12, plus there are many rejected outliers, thus a consensus is lacking.
See the EISN chart below.
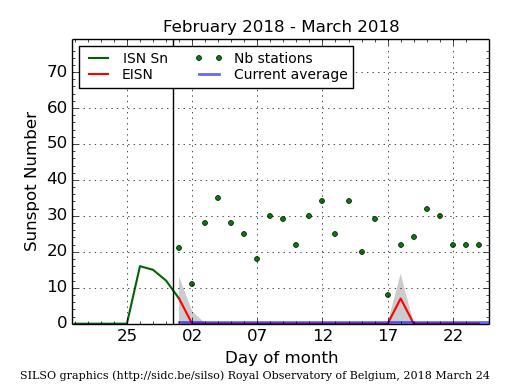
- Daily Sunspot Plot thru 03-24-2018_EISNcurrent.png (37.7 KiB) Viewed 1530 times
Looking at NOAA's GOES x-ray flux charts, there has been a consistent plunge down to the lower A levels.
During a deep solar minimum, which we are approaching, the readings get down to A0. Right now,
the chart shows very infrequent A0 readings, with the average reading in the A1 levels.
See the flat lined chart below and notice the red line.
- 03-24-2018_spotless sun_solar minimum levels infrequently reading A0_goes-xray-flux-6-hour.gif (11.35 KiB) Viewed 1530 times