Non-political secular news and anything else (within the boundaries of Christian morality and good taste) that is not on-topic in any other section. Any politically charged material must be posted in the private Political and Social Issues forum; please PM admin for access. All Forum Rules apply. No polemics. No heated discussions. No name-calling.
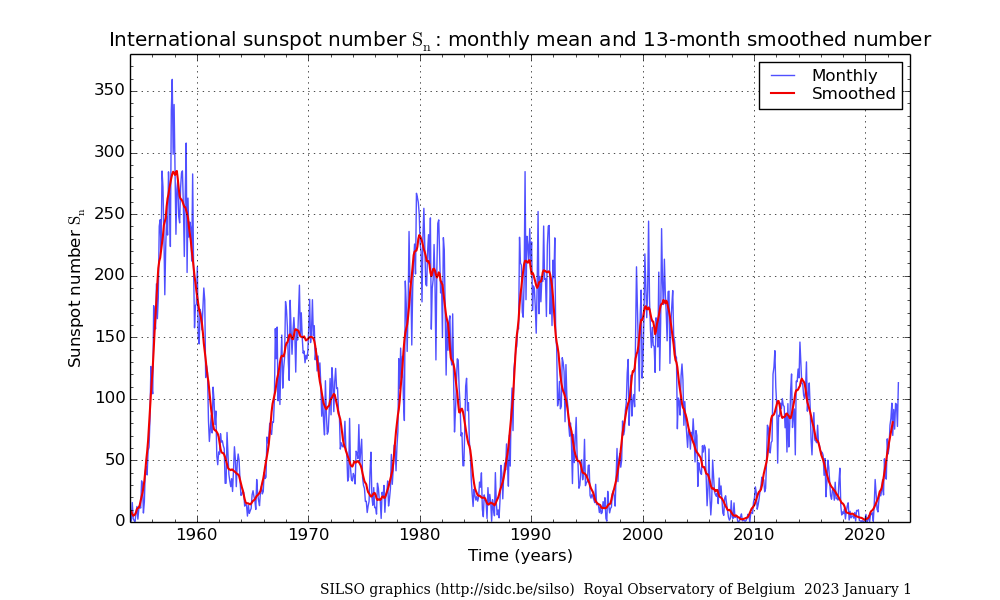
Here is a plot showing sunspot numbers from 1954 to 2016.
Note how our recent solar cycle 24 is the lowest one in recent years. The years 1958-1959 had more than twice the sunspot numbers of 2014.
Looking at this sunspot plot again, particularly the one in June 2016, which was very low, averaging about 20, we appear to be entering into a mini ice age faster than predicted. However, the plots for July 2016, show an increasing sunspot number, which is not surprising as the sun is unstable. Nevertheless, the drop was quite dramatic in June.
We might be entering into a very deep 1400 year solar minimum, which could last years, perhaps 100 years.
The last time when we had such a deep solar minimum, Muslims almost took over the known world. This was about 600 A.D.
Attachments
solar minimums+6000+years.jpg (148.66 KiB) Viewed 6996 times
Here is the current solar cycle 24 as of March 1, 2017, showing its demise. Notice the coming solar minimum of solar cycle 25 has been highly unpredictable as shown by the fact that it does not follow two major scientific predictions (SC and CM) but is exhibiting a very sharp decline of its own.
Attachments
monthly-sunspot-numbers-smoothed-2017-03.png (145.43 KiB) Viewed 6974 times
Here is the plot of the solar cycles since the 1700s.
Again, notice how solar cycle 24 is much smaller and seems to be leading into a very long solar minimum like that found in the late 1600s through the early 1700s, which was the Maunder Minimum.
Note too, how the current cycle 23 ended with a very deep solar minimum that was much deeper than those of the middle to late 1900s. Solar cycle 24 is plunging rapidly into a new solar minimum ice age which is defying all predictions.
Attachments
Sunspot numbers.international-1700-2016 Nov.png (143.46 KiB) Viewed 6974 times
This graph shows the number of spotless days per year since 1849. There are 111 years (including 2014 and 2016) with at least 1 spotless day, of which 24 years with 150 or more spotless days. 1913 is recordholder with a staggering 311 days, while 2008 ranks fourth in years with a spotless sun (265 days). With 262 days, 2009 falls just short of 2008 but it still makes it in the top 5 of years with most blanc suns, testifying of the deep minimum prior to the onset of SC24.
Here is the current solar cycle 24 as of March 1, 2017, showing its demise. Notice the coming solar minimum of solar cycle 25 has been highly unpredictable as shown by the fact that it does not follow two major scientific predictions (SC and CM) but is exhibiting a very sharp decline of its own.
Comparing the two cycles one year apart, April 1, 2017 to April 1, 2018, shows a steep decline in this solar minimum.
Also look at the CM prediction favored by Belgium in April 2017 for Jan. 2018 (EISN of 30), and then notice how that prediction was a huge fail as the Jan. 2018 ISN was only 6.7. This is a difference of 23.3. Belgium does not think that this solar minimum will be very deep. Even the Standard Curve (SC) prediction is not trustworthy.
monthly-sunspot-numbers-smoothed-2017-04.png (144.41 KiB) Viewed 6013 times
monthly-sunspot-numbers-smoothed-2018-04.png (140.54 KiB) Viewed 6013 times
Finally, compare the latest July 2, 2018 CM prediction, showing that this solar minimum will gradually end sometime after July 2019 with a rapid increase in sunspot numbers.
monthly-sunspot-numbers-smoothed-2018-07-wolfjmms.png (139.05 KiB) Viewed 6013 times