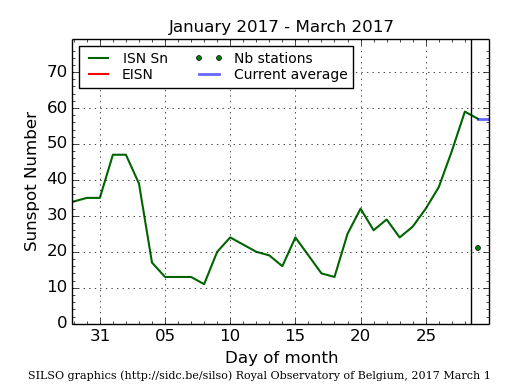
- Daily Sunspot Plot thru 03-01-2017_EISNcurrent.png (42.12 KiB) Viewed 1169 times
The above plot is the Daily Sunspot Plot through March 1, 2017, only one day after the Feb. 28, 2017 posting.
(1) the spotless day on Feb. 8, 2017 has vanished once again as if SILSO in Belgium and NOAA cannot make up their minds.
(2) Other plots have increased in values, thus dramatically increasing the daily sunspot average.
Therefore, the manipulated daily sunspot number for February will be roughly 25 to 26.
Here are my rough calculations of the manipulated data from these two plots:
Notice that all the data have been increased except for five days, colored in red.
Note also that the final monthly report from SILSO will not show rounded figures as I am using here.
Month = February 2017 Sunspot Data by EISN/SILSO.
The newly manipulated data is from March 1 while the old data is taken from Feb. 28, 2017
Day / New - Old = Manipulation
2-01 / 47 - 42 = + 05
2-02 / 47 - 43 = + 04
2-03 / 40 - 34 = + 06
2-04 / 17 - 11 = + 06
2-05 / 13 - 10 = + 03
2-06 / 13 - 12 = + 01
2-07 / 13 - 12 = + 01
2-08 / 11 - 00 = + 11
2-09 / 20 - 19 = + 09
2-10 / 24 - 20 = + 04
2-11 / 22 - 18 = + 04
2-12 / 20 - 18 = + 02
2-13 / 19 - 17 = + 02
2-14 / 16 - 16 = zero
2-15 / 24 - 24 = zero
2-16 / 18 - 14 = + 04
2-17 / 14 - 14 = zero
2-18 / 13 - 14 = -- 01
2-19 / 26 - 22 = + 04
2-20 / 32 - 30 = + 02
2-21 / 26 - 26 = zero
2-22 / 29 - 24 = + 05
2-23 / 24 - 20 = + 04
2-24 / 26 - 22 = + 04
2-25 / 35 - 30 = + 05
2-26 / 39 - 35 = + 04
2-27 / 54 - 45 = + 09
2-28 / 59 - 51 = + 08
Total point change = +98
Divided by 28 days = 3.5 point discrepancy per day
This is only a rough calculation, however ....
Old data yields approximately 22.5 sunspots per day
New manipulated data yields approximately 26.0 sunspots per day.