As the Sun Turns: Solar Minimums and Maximums

Non-political secular news and anything else (within the boundaries of Christian morality and good taste) that is not on-topic in any other section. Any politically charged material must be posted in the private Political and Social Issues forum; please PM admin for access. All Forum Rules apply. No polemics. No heated discussions. No name-calling.
Post Reply
User avatar
Maria
Archon
Posts: 8428
Joined: Fri 11 June 2004 8:39 pm
Faith: True Orthodox Christian
Jurisdiction: GOC
Location: USA

Re: As the Sun Turns: Solar Minimums and Maximums

Post by Maria »

http://www.heraldsun.com.au/blogs/andre ... 1486494662

But the whistleblower, Dr John Bates, a top NOAA scientist with an impeccable reputation, has shown The Mail on Sunday irrefutable evidence that the paper was based on misleading, ‘unverified’ data.

It was never subjected to NOAA’s rigorous internal evaluation process – which Dr Bates devised...

The sea dataset used by Thomas Karl and his colleagues – known as Extended Reconstructed Sea Surface Temperatures version 4, or ERSSTv4, tripled the warming trend over the sea during the years 2000 to 2014 from just 0.036C per decade – as stated in version 3 – to 0.099C per decade.

Emphasis mine.

While the mainstream media will not speak about this WaterGate2 data changing, the Herald Sun in Australia, The Mail, and The Sun in the UK have reported this story.

Lord Jesus Christ, have mercy on me a sinner.

User avatar
Maria
Archon
Posts: 8428
Joined: Fri 11 June 2004 8:39 pm
Faith: True Orthodox Christian
Jurisdiction: GOC
Location: USA

Re: As the Sun Turns: Solar Minimums and Maximums

Post by Maria »

Surprise new sunspot 2635 has been quite explosive during this solar minimum with THREE C-Class and multiple B-Class Solar Flares so far on Feb. 9, 2017.

02-09-2017_Multiple C flares from Sunspot 2635_goes-xray-flux-6-hour.gif
02-09-2017_Multiple C flares from Sunspot 2635_goes-xray-flux-6-hour.gif (12.02 KiB) Viewed 1234 times

http://www.swpc.noaa.gov/products/solar ... nt-reports

:Product: 20170209events.txt
:Created: 2017 Feb 09 0737 UT
:Date: 2017 02 09

Prepared by the U.S. Dept. of Commerce, NOAA, Space Weather Prediction Center

Please send comments and suggestions to SWPC.Webmaster@noaa.gov

#

Missing data: ////

Updated every 5 minutes.

Edited Events for 2017 Feb 09

#
#Event Begin Max End Obs Q Type Loc/Frq Particulars Reg#
#-------------------------------------------------------------------------------

6080 + 0042 0050 0055 G15 5 XRA 1-8A B2.7 1.4E-04 2635

6090 + 0135 0140 0142 G15 5 XRA 1-8A B3.1 6.9E-05 2635

6100 + 0145 0151 0156 G15 5 XRA 1-8A C1.1 4.2E-04 2635

6110 + 0256 0309 0316 G15 5 XRA 1-8A B6.0 4.4E-04 2635

6120 + 0320 0326 0329 G15 5 XRA 1-8A C1.3 4.0E-04 2635

6130 + 0531 0542 0549 G15 5 XRA 1-8A B6.1 4.5E-04 2635

6140 + 0605 0612 0615 G15 5 XRA 1-8A B3.8 1.6E-04 2635

6150 + 0631 0635 0637 G15 5 XRA 1-8A B3.3 7.5E-05 2635

6160 + 0655 0702 0704 G15 5 XRA 1-8A C1.1 2.9E-04 2635

Lord Jesus Christ, have mercy on me a sinner.

User avatar
Maria
Archon
Posts: 8428
Joined: Fri 11 June 2004 8:39 pm
Faith: True Orthodox Christian
Jurisdiction: GOC
Location: USA

Re: As the Sun Turns: Solar Minimums and Maximums

Post by Maria »

There has been a change ... one that seems more consistent and believable. With the appearance and growth of a new Beta sunspot, #2635, the data has changed from "0" to "7", so there is no longer a spotless day for February 8.

Lord Jesus Christ, have mercy on me a sinner.

User avatar
Maria
Archon
Posts: 8428
Joined: Fri 11 June 2004 8:39 pm
Faith: True Orthodox Christian
Jurisdiction: GOC
Location: USA

Re: As the Sun Turns: Solar Minimums and Maximums

Post by Maria »

Now the daily sunspot plot has the image of a skunk:

Attachments
Daily Sunspot Plot through 2-12-2017_Skunk_EISNcurrent.png
Daily Sunspot Plot through 2-12-2017_Skunk_EISNcurrent.png (45.35 KiB) Viewed 1217 times

Lord Jesus Christ, have mercy on me a sinner.

User avatar
Maria
Archon
Posts: 8428
Joined: Fri 11 June 2004 8:39 pm
Faith: True Orthodox Christian
Jurisdiction: GOC
Location: USA

Re: As the Sun Turns: Solar Minimums and Maximums

Post by Maria »

Now the plot has changed again, restoring the spotless day on Feb. 8, 2017.

What gives? International scientists are now reporting old data.

Attachments
Daily Sunspot Plot thru 02-21-2017_EISNcurrent.png
Daily Sunspot Plot thru 02-21-2017_EISNcurrent.png (46.8 KiB) Viewed 1200 times

Lord Jesus Christ, have mercy on me a sinner.

User avatar
Maria
Archon
Posts: 8428
Joined: Fri 11 June 2004 8:39 pm
Faith: True Orthodox Christian
Jurisdiction: GOC
Location: USA

Re: As the Sun Turns: Solar Minimums and Maximums

Post by Maria »

Sunspot plot through Feb. 28, 2017 -- Notice the grey shadows indicating the range of responses from worldwide reporting stations:

According to this graph, the average daily sunspot plot for February is roughly 22.5.

Attachments
Daily Sunspot Plot thru 02-28-2017_EISNcurrent.png
Daily Sunspot Plot thru 02-28-2017_EISNcurrent.png (52.17 KiB) Viewed 1168 times

Lord Jesus Christ, have mercy on me a sinner.

User avatar
Maria
Archon
Posts: 8428
Joined: Fri 11 June 2004 8:39 pm
Faith: True Orthodox Christian
Jurisdiction: GOC
Location: USA

Re: As the Sun Turns: Solar Minimums and Maximums

Post by Maria »

Daily Sunspot Plot thru 03-01-2017_EISNcurrent.png
Daily Sunspot Plot thru 03-01-2017_EISNcurrent.png (42.12 KiB) Viewed 1168 times

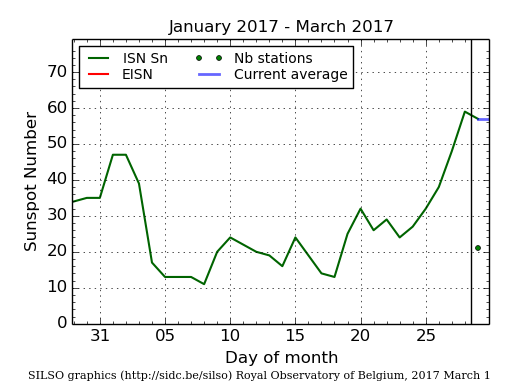
The above plot is the Daily Sunspot Plot through March 1, 2017, only one day after the Feb. 28, 2017 posting.

(1) the spotless day on Feb. 8, 2017 has vanished once again as if SILSO in Belgium and NOAA cannot make up their minds.
(2) Other plots have increased in values, thus dramatically increasing the daily sunspot average.

Therefore, the manipulated daily sunspot number for February will be roughly 25 to 26.

Here are my rough calculations of the manipulated data from these two plots:
Notice that all the data have been increased except for five days, colored in red.
Note also that the final monthly report from SILSO will not show rounded figures as I am using here.

Month = February 2017 Sunspot Data by EISN/SILSO.
The newly manipulated data is from March 1 while the old data is taken from Feb. 28, 2017

Day / New - Old = Manipulation

2-01 / 47 - 42 = + 05
2-02 / 47 - 43 = + 04
2-03 / 40 - 34 = + 06
2-04 / 17 - 11 = + 06
2-05 / 13 - 10 = + 03
2-06 / 13 - 12 = + 01
2-07 / 13 - 12 = + 01
2-08 / 11 - 00 = + 11
2-09 / 20 - 19 = + 09
2-10 / 24 - 20 = + 04
2-11 / 22 - 18 = + 04
2-12 / 20 - 18 = + 02
2-13 / 19 - 17 = + 02
2-14 / 16 - 16 = zero
2-15 / 24 - 24 = zero
2-16 / 18 - 14 = + 04
2-17 / 14 - 14 = zero
2-18 / 13 - 14 = -- 01
2-19 / 26 - 22 = + 04
2-20 / 32 - 30 = + 02
2-21 / 26 - 26 = zero
2-22 / 29 - 24 = + 05
2-23 / 24 - 20 = + 04
2-24 / 26 - 22 = + 04
2-25 / 35 - 30 = + 05
2-26 / 39 - 35 = + 04
2-27 / 54 - 45 = + 09
2-28 / 59 - 51 = + 08

Total point change = +98

Divided by 28 days = 3.5 point discrepancy per day

This is only a rough calculation, however ....

Old data yields approximately 22.5 sunspots per day
New manipulated data yields approximately 26.0 sunspots per day.

Lord Jesus Christ, have mercy on me a sinner.

Post Reply